
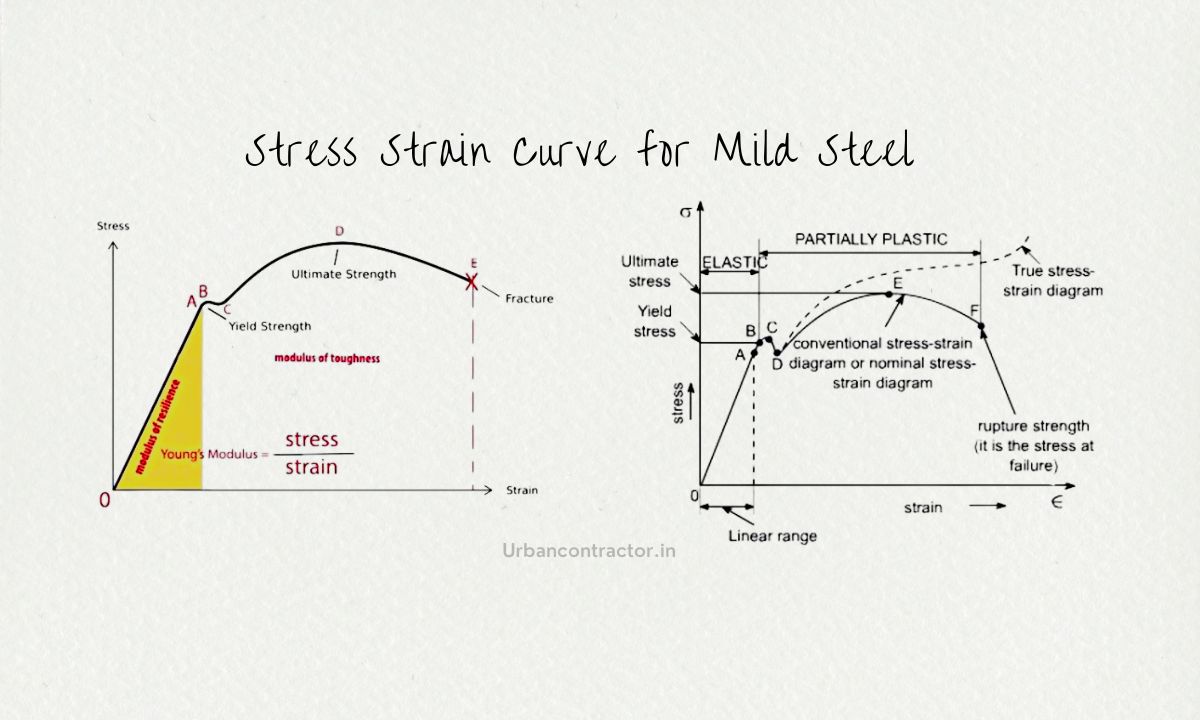
Stress Strain Curve for Mild Steel
The stress and strain curve for mild steel consists of strain along the x-axis and stress along the y-axis.
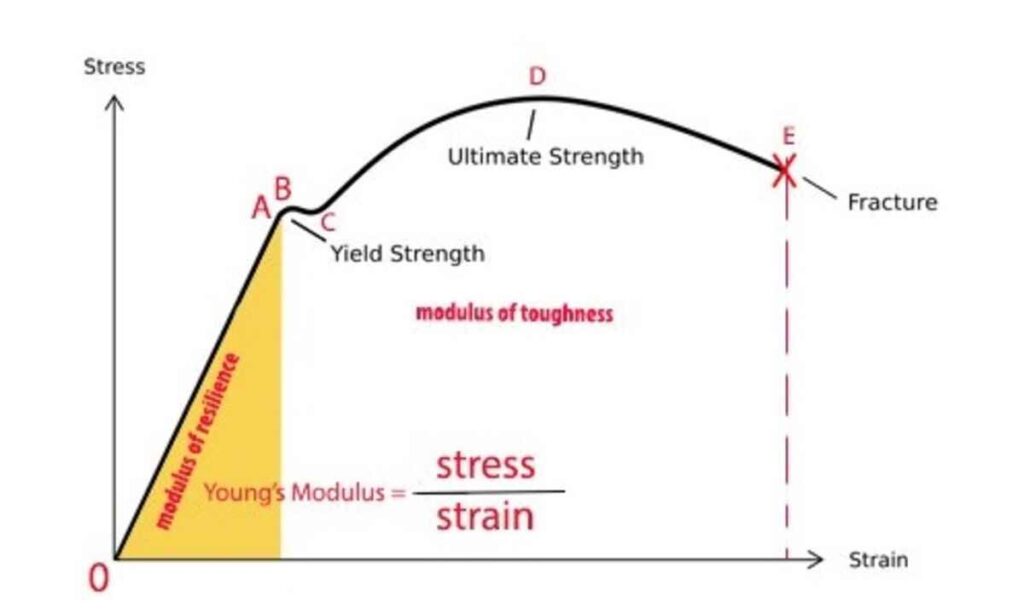
When a steel bar is projected to tensile force it exhibits some elongation. If the applied force is small, then the ratio of stress and strain will remain proportional as we can see from the above stress-strain curve for a mild steel graph i.e. Straight line from O to A. It is known as the limit of proportionality.
If the applied force is greater, then the ratio of stress and strain will not remain proportional and the material will experience elastic deformation as we can see from the above stress-strain curve for a mild steel graph i.e. from A to B. It is known as the elastic limit.
Once the mild steel surpasses its elastic limit, it undergoes plastic deformation. This starts the yield point, also known as point B or the upper yield point.
From the above stress-strain curve for a mild steel graph, the correlation between stress and strain deviates from a linear trajectory, curving from point C (lower yield point) through D (maximum ultimate stress) and culminating at E (fracture stress).
Also Read: Mud Floor – Ideas, Cost, Installation, Pros and Cons
Description of Terms in Stress-Strain Curve For Mild Steel Graph
1. Stress: If the external force causes a change in material dimensions, then the material is in a state of stress.
Formula : σ = F/A
Stress is represented by σ (the Greek letter sigma)symbol. For tensile (+) and compressive (-) forces. The standard international unit of stress is the pascal (Pa), where 1 Pa = 1 N/m2.
2. Strain: Strain can be defined as the change in the dimension of the material with respect to the original. Strain is denoted by the symbol ε(epsilon).
Formula : ε = (L-L0) / L0
3. Elasticity: Elasticity refers to a material’s ability to revert to its initial shape once an external force is removed.
4. Plasticity: Plasticity denotes the capacity for a material to retain deformation without fracturing even after the force is no longer applied.
5. Hooks Law: According to Hook’s law F = -kL, Where K is constant, F is applied force and L is distance. Within the proportional limit (straight line from O and A), strain is proportionate to stress.
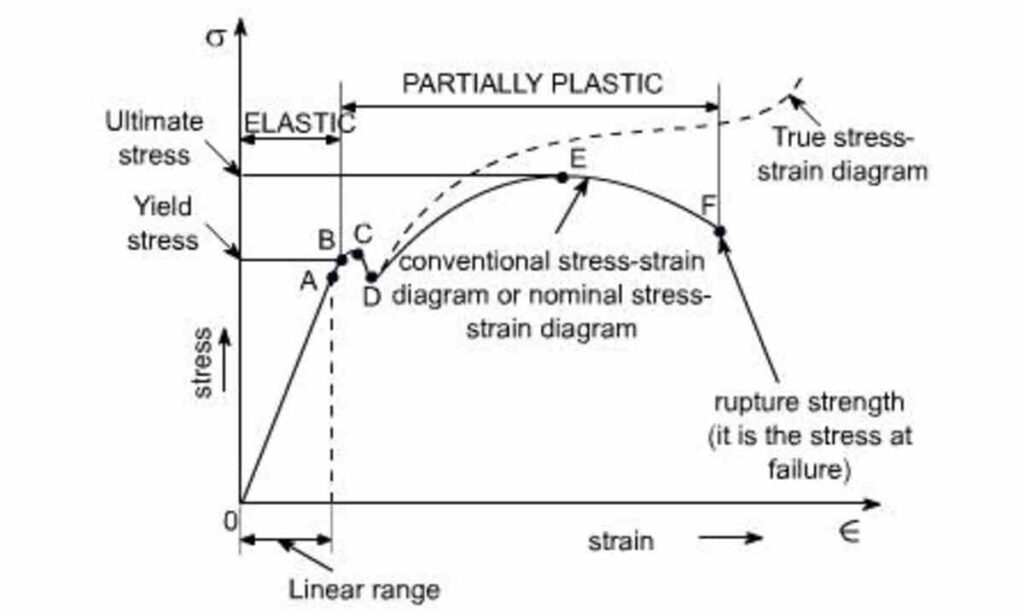
6. Yield Strength: Yield strength represents a phase in the curve where extension occurs under the application of even small or negligible loads. The CD curve illustrates the yield strength of mild steel.
7. Ultimate Strength: Ultimate strength refers to the maximum strength a material can withstand without fracturing. The stress at this point is termed ultimate stress. Point E signifies the ultimate strength, after which the material can abruptly fracture even under minor loads.
8. Fracture Point: Point F marks the fracture point on the curve. This is where the material’s strength is surpassed, resulting in fracture, and the strength at this point is known as rupture strength.
Also Read: Aggregate Test List – Types, Procedures, and IS Codes